

Interactives + graphics
InTERACTIVES + graphics
A small selection of infographics, charts, interactives and comics from my work at The Conversation and The Pharmaceutical Journal.
interactives, charts and infographics

A microsite for The Conversation that explores the impact of the 2019-20 bushfires on 119 different Australian species and their recovery by mid-2020. This project won the The Universities Australia Award for Excellence in University Research Reporting from the National Press Club.

A microsite and interactive mapping the path of Cook and the Endeavour through the Pacific, the impact of colonialism and the Indigenous perspective and response. This project was shortlisted for the Excellence and Innovation in Visual Digital Storytelling, Small Newsroom Online Journalism Award.

Interactive long-form explainer on making the most of travel vaccination consultations for The Pharmaceutical Journal, sponsored and produced independently but with support from Sanofi.

Infographic article exploring the cause of allergic response, impact of allergic rhinitis and pharmaceutical treatment for The Pharmaceutical Journal

At-a-glance infographic for the 2022 pre-election Coalition federal Australian budget.
An interactive explainer at The Conversation on the Strait of Hormuz following Australia joining the US-led naval convoy.
An interactive graphic from just prior to the 2019 Federal election covering all available data on the controversial Adani Carmichael coal mine for The Conversation.

Data/chart-heavy piece for The Conversation from a survey of 22 leading Australian economists about the economic outlook for the majority of the Labor government’s term.

Animation from an article explaining how pumped hydro-electricity energy and storage works in five gifs at The Conversation.

An infographic for The Conversation breaking breaking down what Centrelink's reported waiting time hides. Widely republished and breaking at the time of publishing.

A simple interactive made to explain the money the big four banks make by delaying passing on interest rate changes. This piece (and the specific information in the infographic) was referred to in questioning of ANZ chief Shayne Elliott by the House Representative Economics Committee's inquiry into banking.

Explanatory infographic on the Australian energy grid. Full article here.

An interactive explainer on proposed changes to ASIO legislation, using a quiz flow chart to explain the changes based on the reader's own assumptions.
Hottest 100 gender tally – created as a personal project on the night of January 26 2016, to break show the gender discrepancy in the Triple J countdown.
Comic explainers
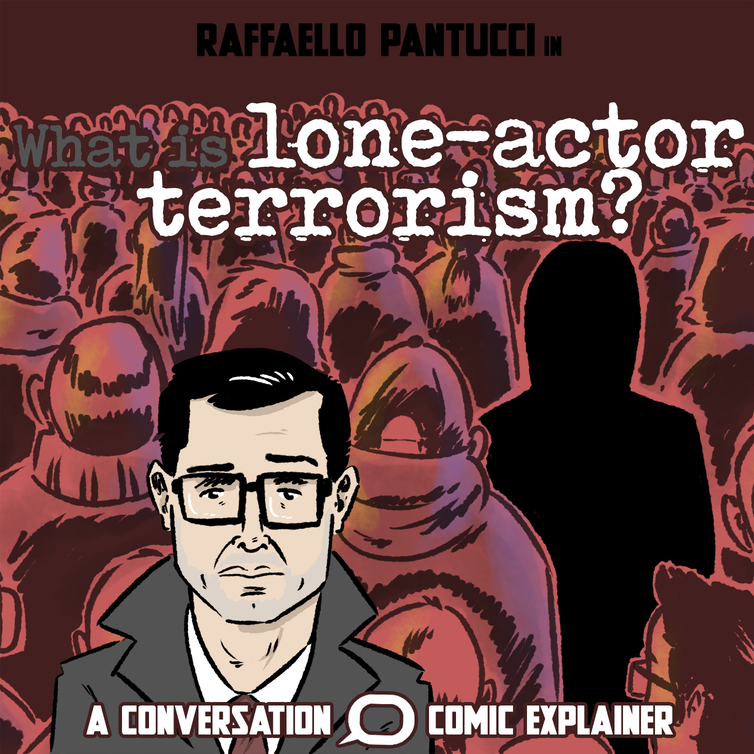
Comic explainer at The Conversation on lone-actor terrorism with RUSI terror expert Raffaello Pantucci.

Long, single panel comic explainer for The Conversation on how old standing trees with hollows in them are integral to wildlife and biodiversity and are no longer being allowed to survive in Australian forests, a collaboration with David Lindenmeyer and then-Environment+Energy deputy editor Maddi De Gabriele.

From a long-form comic on how memory works at The Conversation, a collaboration with the Florey Institute's Dr Jee Hyun Kim. Co-published with the ABC.

Comic explainer for The Conversation on Islamic finance with Mamiza Haq.